State Machine Visualizer
Peasy State Machine Visualizer
Peasy state machines visualization helps aid design documents, visualize P code, and better understand the formal model of a complex system.
Acknowledgement
The Stately tool's state machine visualization capability has been leveraged to visualize the logic of a given P state machine. To understand more about XState go through their official documentation and Github repository.
In order to visualize P state machines, follow these steps or scroll down to watch a demo:
- Press F7 to run the command
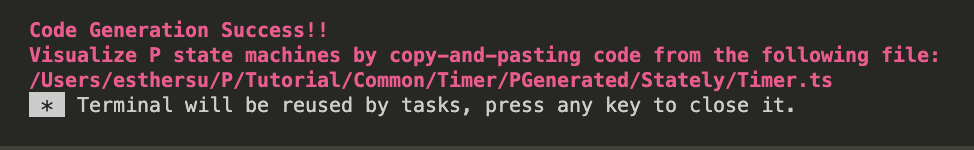
p compile --mode statelyin the terminal. Your visualization code is generated! A message in red should be sent through the terminal.
-
Navigate to the file using Ctrl
Clickor CmdClick. Copy-and-paste the file contents into Stately. -
Click the Visualize button on the bottom left! Voila! Here is an example visualization using the P Tutorial's Two Phase Commit project.
Demo Video: How to use state machine visualization tool?
How to Navigate Stately's Open Source Visualization Website
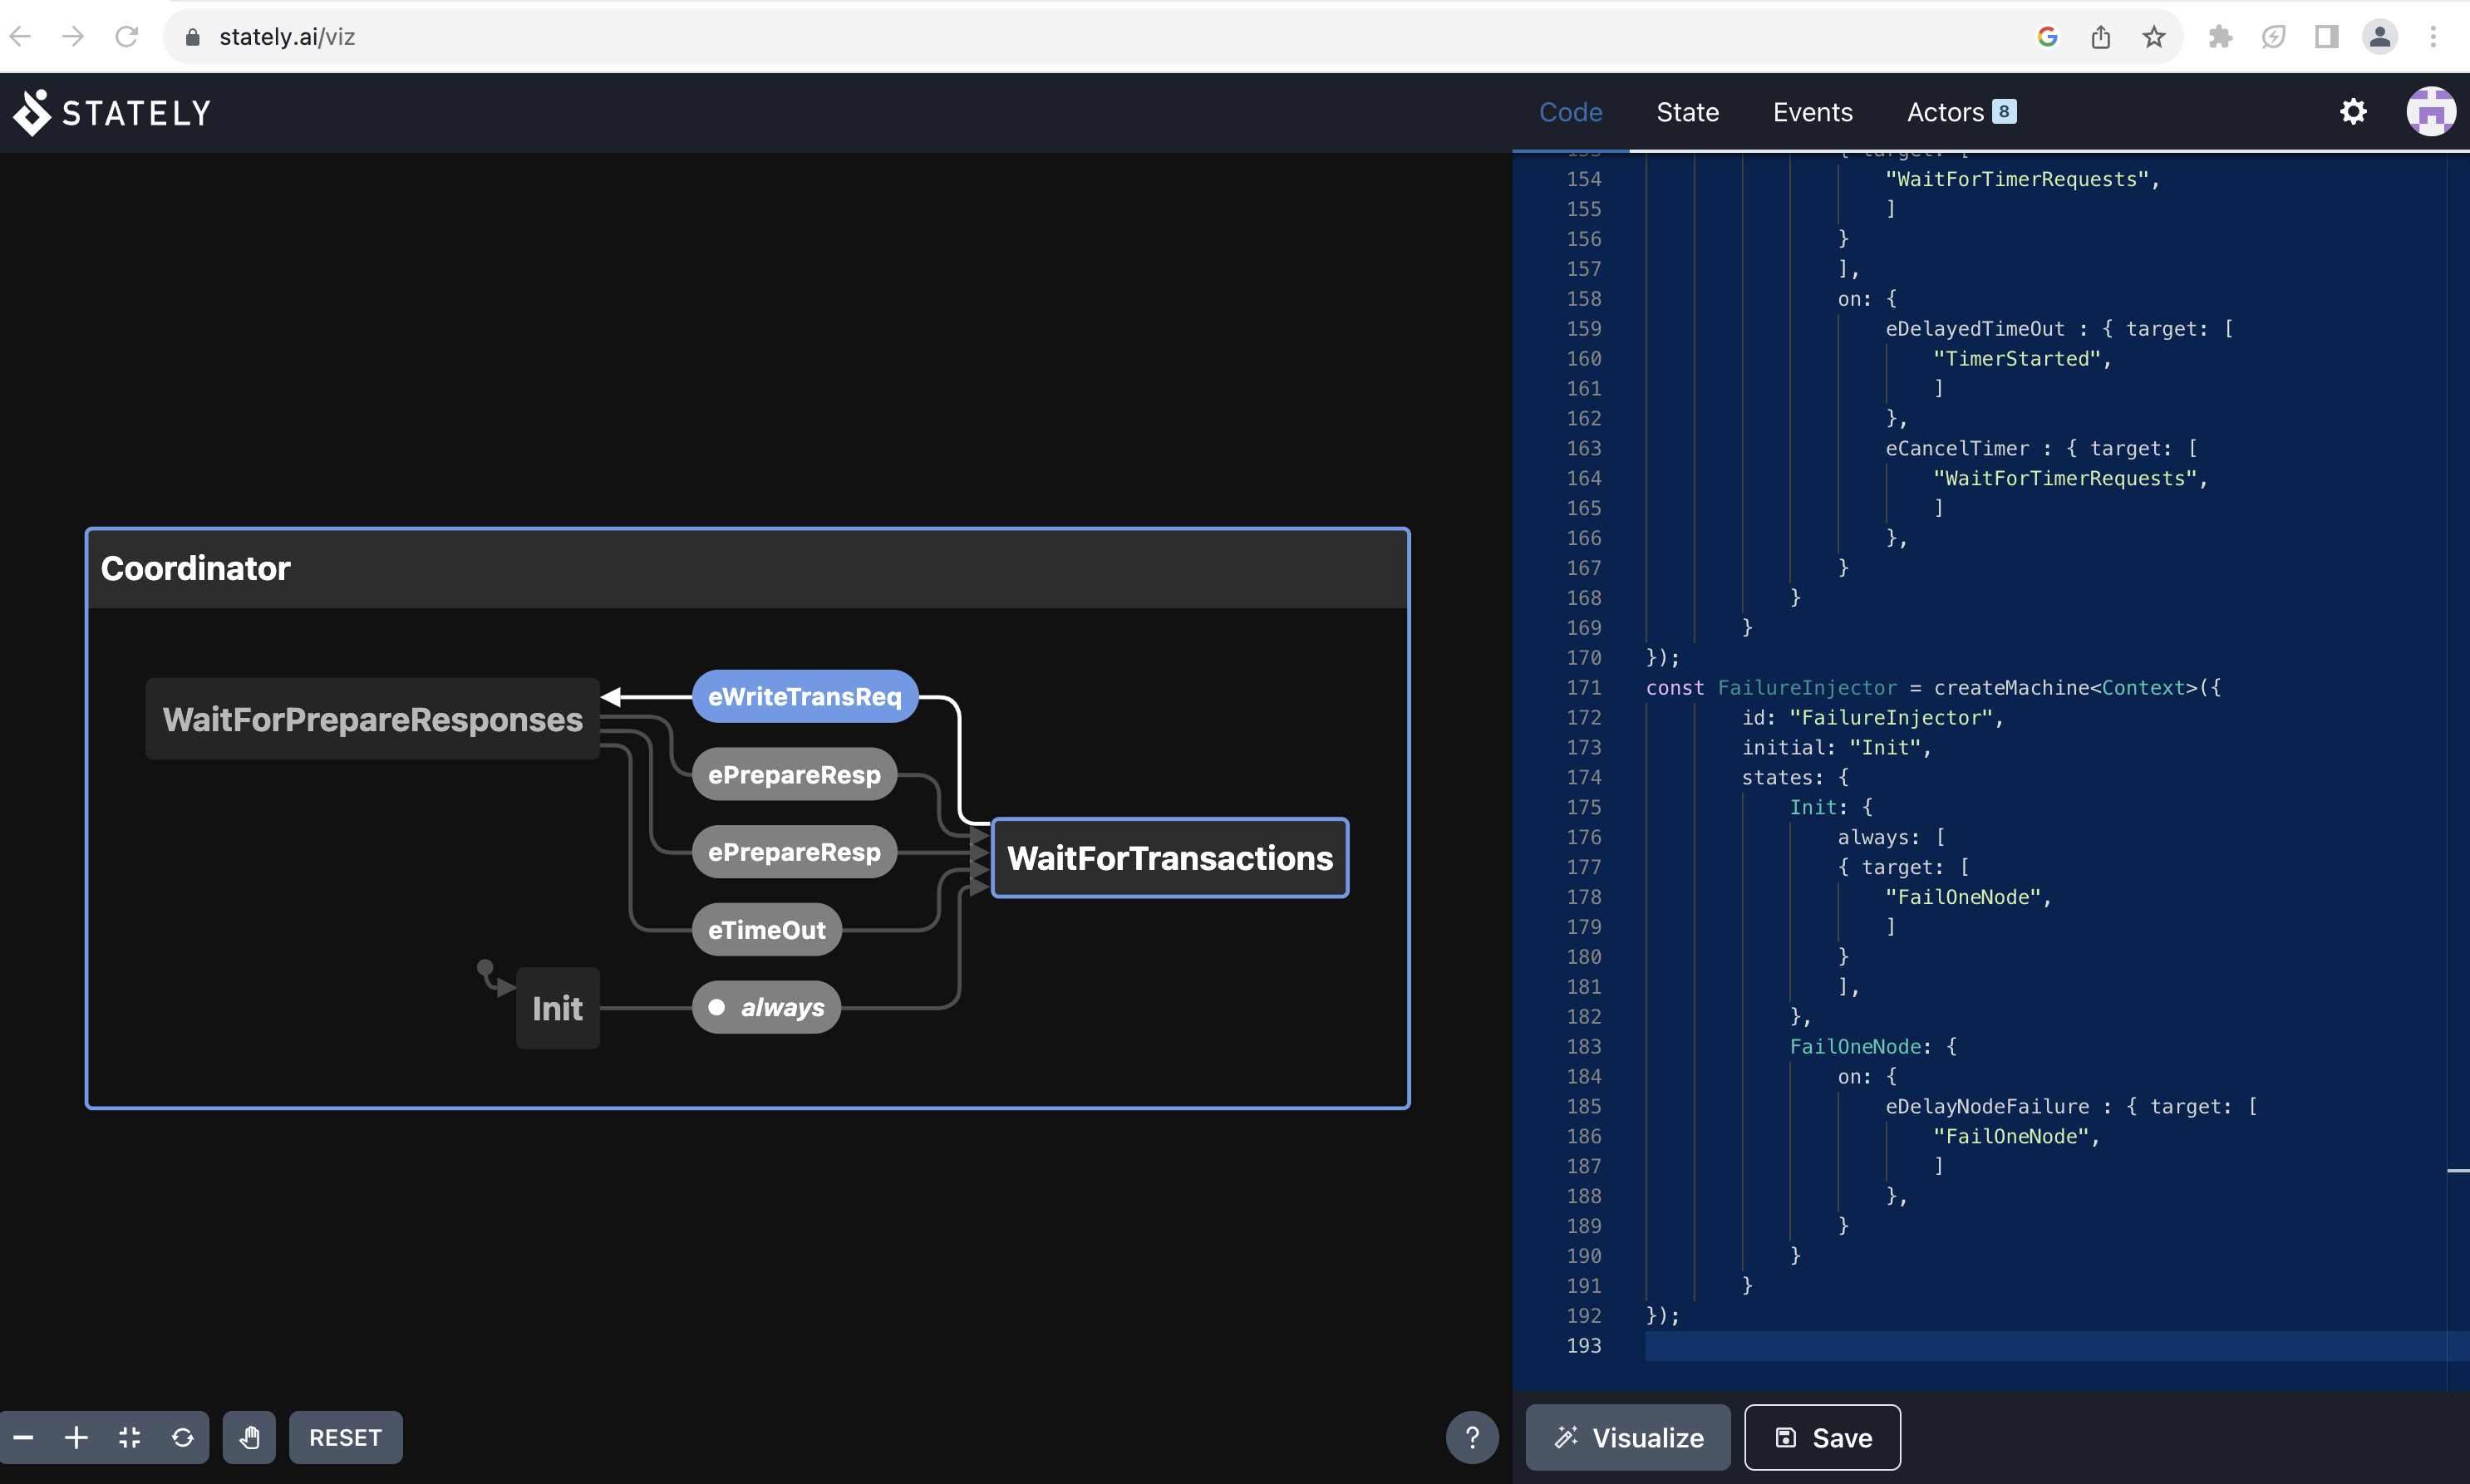
Every visualization contains exactly one state machine. The name of the machine is at the top left; in this case, the machine is called Coordinator. All the shapes and arrows inside are part of the state machine Coordinator.
States are represented with squares, and events are represented with ovals.The beginning state is pointed to with an arrow. In the above case, the beginning state is Init.
The state WaitForTransaction is outlined in blue because the machine always travelled from the Init State to the WaitForTransaction state. The event eTransReq is colored in light blue because the state machine Coordinator is waiting for that one event to happen. Click eWhileTransReq, and the three other events will light up because the Coordinator machine is now waiting for one of the other three events to happen.
This way, you can interact with these P state machine visualizations too!
Stately's website contains four tabs:
- Code Tab: Use this tab to copy-and-paste code to visualize state machines.
- State Tab: This tab provides information on the state the user is currently at in the machine.
- Events Tab: This tab logs all events that have occurred so far among all machines.
- Actors Tab: Use this tab to switch to different P state machines in the visualization.