Getting Started
Getting Started
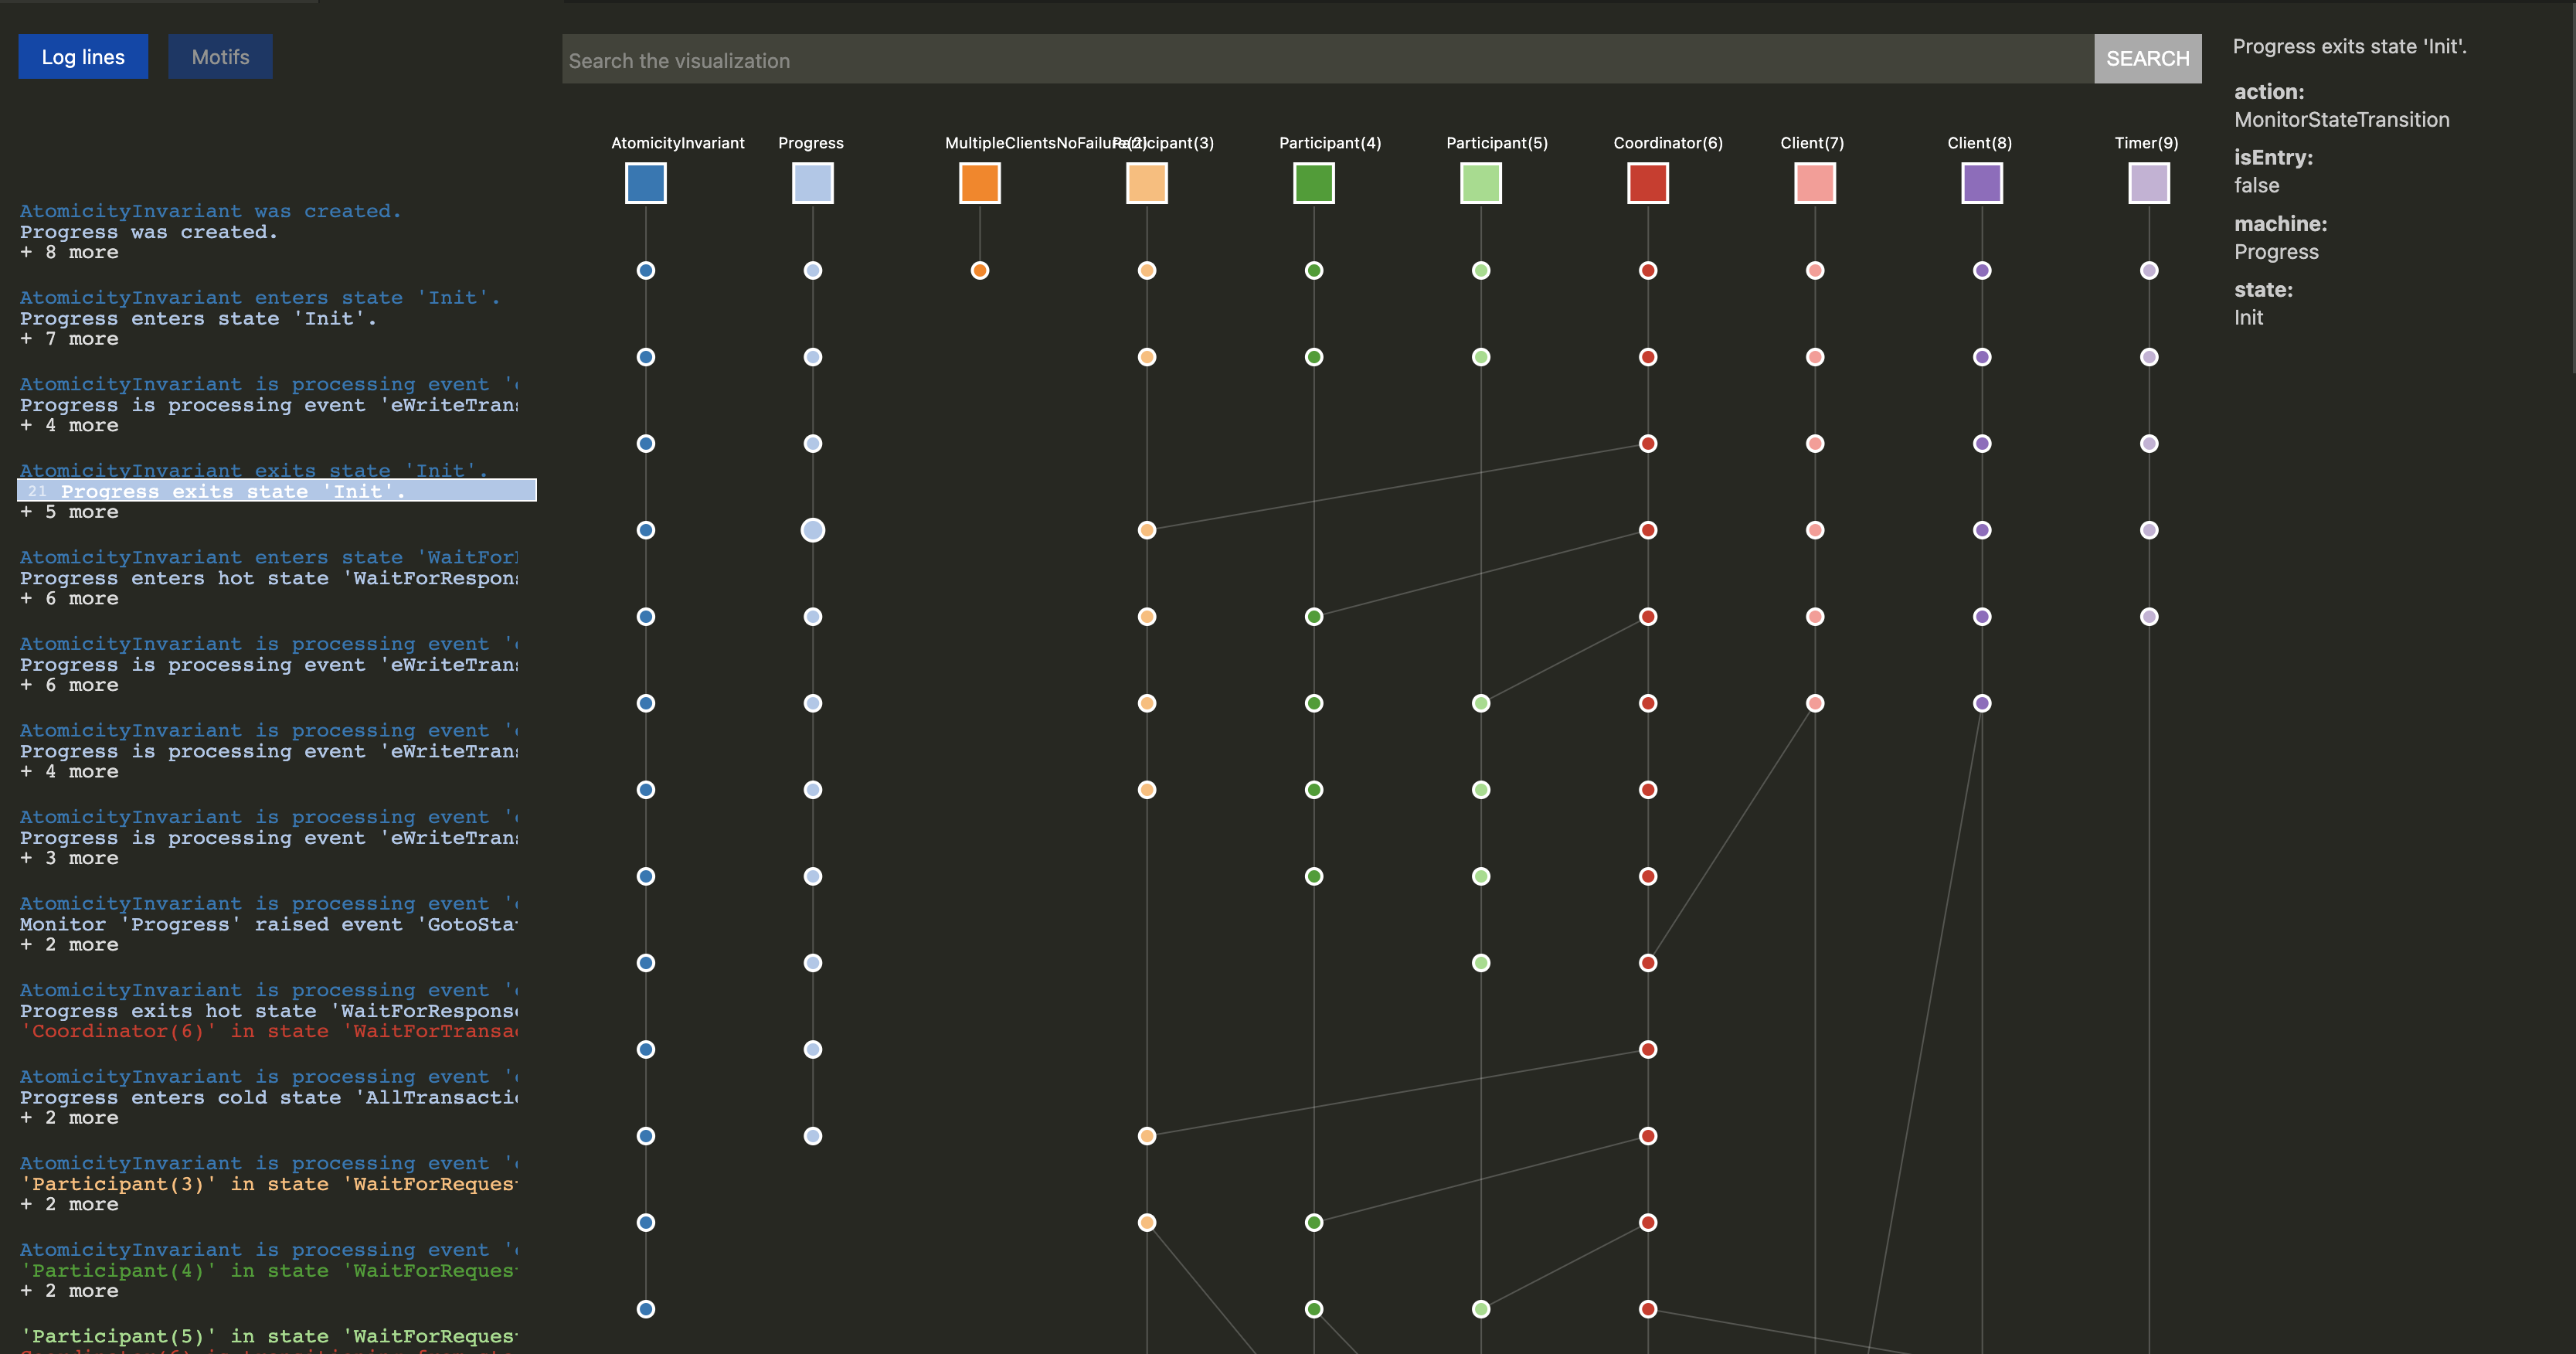
Error traces for complex distributed systems are hard to debug as they involve nontrivial interleaving of messages. Peasy provides trace visualization to aid debugging counter examples provided by the P checker. Peasy helps visualize traces as message sequence charts, perform search, and do motif based analysis.
Acknowledgement
The trace visualizer in Peasy is built on top of ShiViz visualization tool. We recommend that you go through their Visualizing Distributed System Executions paper to learn more about the ShiViz tool.
Launching
First, ensure that you are in a P project directory and that you have JSON error traces available!
Once you have a JSON trace, you can press F6 to quickly launch the trace visualizer. This should open a new tab in your Visual Studio Code, and a file dialog window will appear, prompting you to select the JSON traces to visualize.
Alternatively, you can launch the visualizer using the Visual Studio Code shortcut Cmd + Shift + P (Mac) or Ctrl + Shift + P (Windows) to open the Command Palette. Then, type PeasyViz: Run and click to launch the visualizer.
Demo Video: How to launch Peasy trace visualizer?
Terminology
| Term | Description |
|---|---|
| Log | The text corresponding to an action within the trace. |
| Motif | Structural patterns in the visualization graph. |
| Fields | Each JSON log entry contains the log text and fields associated with the log. For example, field action indicates the type of log it is (SendEvent, ReceiveEvent, StateTransition, etc.). Field target specifies the target machine of a SendEvent log entry, while field machine provides the name of the machine. More details can be found in P JSON Output. |
Breakdown
| Left Panel | Center Panel | Right Panel |
|---|---|---|
|
|
|